All published articles of this journal are available on ScienceDirect.

Early Stroke Risk Score as a Preventive Measure in Indonesia: A Cross-Sectional Study
Abstract
Introduction
Stroke is a leading cause of mortality and disability in the world and Southeast Asia. There is a lack of preventive measures for stroke in the Indonesian population. Hence, this study aimed to provide early detection of stroke risk by determining the contribution of each stroke risk factor using a score.
Methods
In this cross-sectional study, a total of 201 participants were included. The multivariate model was built by including all risk factors: age, gender, blood pressure, atrial fibrillation, smoking status, level of cholesterol, blood glucose, activity, BMI, and family history of stroke. The weighting of risk factors in the study was done using multiple logistic regression.
Results
No significant effect was observed in gender, regular exercise, and level of cholesterol. The highest risk factor of stroke from our model was observed in patients with hypertension [OR = 13.48, 95% CI: 4.86 – 37.35], followed by diabetes more than 200 mg/DL [OR = 11.83, 95% CI: 2.40 – 58.09] and between 101 – 199 mg/dL [OR = 6.94, 95% CI: 2.29 – 20.98], smokers [OR = 8.79, 95% CI: 2.36 – 32.69], patients with irregular heartbeat [OR = 8.73, 95 CI: 1.99 – 38.12], patients with obesity [OR = 0.23, 95% CI: 0.08 – 0.66], and patients aged more than 59 [OR = 4.67, 95% CI: 1.36 – 13.95]. An AUC of 0.87 in our analysis implied that the stroke predicting score offers a good discriminatory ability.
1. INTRODUCTION
A stroke is a neurological disease caused by the interruption of blood vessels in the brain, leading to brain cell damage and death [1]. It is a life-threatening emergency that necessitates immediate medical attention. Blood vessels continuously deliver oxygen and nutrients to the brain. When a brain-supplying blood vessel becomes obstructed or ruptures, blood flow to specific areas of the brain may be interrupted. The interruption in blood circulation deprives brain cells of oxygen and nutrients, resulting in their immediate injury or demise.
It is a leading cause of mortality and disability in the world and South East Asia [2-4]. World Stroke Organization (WSO) showed in a report that there were around 13 million new cases of stroke every year, of which 5 million of them were deaths [5]. In Indonesia, the results of the 2018 RISKESDAS show an increase in the prevalence of non-communicable diseases (NCD), including stroke, from 7 to 10.9%. This number is predicted to continue to rise due to changes in social behavior. The high incidence of stroke is a concern for individuals because it can reduce productivity. The prevalence of stroke in Indonesia is higher than the global average, with a prevalence of 14 per thousand in the Sleman population [6].
The prevalence of stroke in Indonesia tends to increase due to the aging of the population, unhealthy lifestyles, and low stroke awareness [7]. The average age of stroke patients in Indonesia is lower than in developed countries, leading to a higher disability rate, reduced quality of life, and more economic loss. The primary risk factors for stroke in Indonesia are hypertension, obesity, dyslipidemia, diabetes, heart disease, smoking, and low physical activity [8, 9]. Therefore, it is important to increase public awareness of stroke risk factors and prevention measures to reduce the risk of stroke.
The high burden of stroke in the Indonesian population is attributable to preventable vascular risk factors, particularly hypertension, obesity, dyslipidemia, and active tobacco use [10]. In Indonesia, however, studies examining the prevalence of stroke and its associated risk factors are still insufficient. A previous study developed a computerized system to calculate the risk of stroke, which contains nine stroke risk factors found in Indonesian population studies [11]. However, there was no clear information about the applicability of this system for preventing stroke in a clinical setting. Therefore, there is a need for the development of a new stroke risk score study in Indonesia to identify the risk factors for stroke in the Indonesian population.
It is essential to keep in mind that the purpose of stroke risk scores is to provide healthcare professionals with assistance in making decisions regarding preventative actions. They should only be used in conjunction with clinical judgment and the unique characteristics of each patient because they are not definitive predictors. In addition, these risk scores might have some flaws, and they might not be appropriate for all kinds of people or populations. In order to deliver the most accurate assessments possible, it is imperative that those working in healthcare must be aware of the most recent stroke risk assessment guidelines and research. Therefore, screening tools to predict the risk of stroke are highly important. This study aimed to provide another alternative for early detection of stroke risk by determining the contribution of each stroke risk factor using a score.
2. MATERIAL AND METHODS
This was a cross-sectional study. The study included 81 patients with stroke and 120 patients without stroke from 2020 to 2021. The research subjects were divided into two groups: the stroke group and the non-stroke group. Data on risk factors were collected and analyzed to generate scores for each risk factor. The score values were then included in an early detection card as a Stroke Risk Score. The study population for this research included stroke patients treated at the National Brain Centre Hospital in Jakarta, Indonesia (RSPON), in 2020. The non-stroke group consisted of individuals who were living in the West Cilandak area of South Jakarta. This study was approved by the ethical committee of the National Brain Centre Hospital with No. LB.02.01/KEP/064/2021.
In the stroke group, patients were included who had experienced their first stroke, were 17 years or older, were fully conscious (compos mentis), and were receiving either inpatient or outpatient care at the RSPON. However, for the non-stroke group, individuals aged 17 or older with no history of stroke were included. All participants willingly gave their informed consent to take part in the study.
The data were collected using a structured questionnaire and medical examination tools, including equipment for measuring height, weight, blood pressure, and blood glucose and lipid levels. The questionnaire gathered demographic details like name, gender, and age. To ensure comparable groups, strict inclusion and exclusion criteria were applied. Standardized and calibrated instruments were used for all measurements, and data collection followed established protocols carried out by trained staff. Participants completed the questionnaire independently to minimize social desirability bias, and statistical controls were applied as needed.
The sample size was determined using the following formula for comparing proportions between two independent groups:

Where:
p1: 0,357 p1: 0,610
Z [1−α/2]: Z-value for a significance level [α] of 5%, corresponding to 1.96.
Z [1−β]: Z-value for a power 81−β] of 90%, corresponding to 1.28.
The sample size calculation for the hypothesis test comparing two proportions determined that a minimum of 80 participants were needed for the stroke group. Similarly, the non-stroke group required at least the same number of participants, resulting in a minimum of 80 individuals in each group.
Descriptive data were presented in the form of the number (percentage) as categorical data. The stroke risk score was developed using a logistic regression. The multivariate model was built by including all risk factors: age, gender, blood pressure, atrial fibrillation, smoking status, level of cholesterol, blood glucose, activity, BMI, and family history of stroke. Then, the weighting of risk factors in the study was carried out using the multiple logistic regression probability. The beta coefficient for each variable was calculated using the following formula:

The beta coefficients represent the change in the log odds of the event occurring for a one-unit change in the predictor variable. The collected data on these factors were analysed to generate scores for each risk factor, which were then included in an early detection card as a Stroke Risk Score. The accuracy of the model was evaluated by calculations of the area under the curve (AUC) in receiver operating curve (ROC) analysis. Missing data were carefully assessed for completeness and patterns. For minimal missingness (<5%), a complete case analysis was used. For larger gaps, multiple imputation was applied, assuming that the data were Missing at Random (MAR). Sensitivity analyses checked the robustness of results, and cases with data that could not be imputed were excluded and documented. Statistical significance was defined as a p-value of less than 0.05. The statistical analysis was performed using the SPSS version 24 (Chicago, USA).
3. RESULTS
The study included 81 patients with stroke and 120 patients without stroke from 2020 to 2021. Table. 1 illustrates the demographics characteristics of included patients in the study. There were 7 (14.9%) patients in the non-stroke group and 40 (85.1%) patients in the stroke group aged more than 59 years old. Males constituted the majority of the cases of stroke, who were 52 (64.2%), and females were 29 (35.8%). Fifty-one (63%) patients in the stroke group had a family history of stroke. Forty-six (57.5%) patients in the stroke group were smokers. We can also see that the proportion of patients who had hypertension (blood pressure equal to higher than 140/90 mmHg) was 28.7% in the non-stroke group and 71.3% in the stroke group. The proportion of irregular heartbeat was also higher in the stroke group as compared to the non-stroke group with 83.3% and 16.3%, respectively. From this descriptive study, we found that the proportion of patients with diabetes, as indicated by fasting blood glucose levels of more than or equal to 200, was higher in the stroke group (63%) compared to the non-stroke group (37%.).
The multivariate logistic regression model is presented in Table. 2. No significant effect was observed in gender, regular exercise, and level of cholesterol, with p-values of 0.18, 0.37, and 0.64, respectively. The highest risk factor of stroke from our model was observed in patients who had blood pressure equal to or more than 140/90 mmHg (OR = 13.48, 95% CI: 4.86 – 37.35). The risk of stroke was also elevated in patients with diabetes with a level of blood glucose equal to or more than 200 mg/dL (OR = 11.83, 95% CI: 2.40 – 58.09) and between 101 – 199 mg/dL (OR = 6.94, 95% CI: 2.29 – 20.98). We also found that the risk of stroke was increased in smokers (OR = 8.79, 95% CI: 2.36 – 32.69) rather than non-smokers. Irregular heartbeat was found to be associated with an increase in risk of stroke (OR = 8.73, 95 CI: 1.99 – 38.12). In our analysis, we divided BMI into two groups: less than 23 kg/m2 for underweight to normal and equal to or more than 23 kg/m2 for overweight and obesity. We could see that there was also a higher risk of stroke in patients with overweight and obesity (OR = 0.23, 95% CI: 0.08 – 0.66). There was a significant increase in the risk of stroke in individuals aged more than 59 (OR = 4.67, 95% CI: 1.36 – 13.95).
| Variable | Description | n | Non-stroke | Stroke | ||
|---|---|---|---|---|---|---|
| n | % | n | % | |||
| Age | <=59 | 154 | 113 | 73.4 | 41 | 26.6 |
| >59 | 47 | 7 | 14.9 | 40 | 85.1 | |
| Gender | Female | 82 | 53 | 64.6 | 29 | 35.4 |
| Male | 119 | 67 | 56.3 | 52 | 43.7 | |
| Family history of Stroke | No | 151 | 100 | 66.2 | 51 | 33.8 |
| Yes | 50 | 20 | 40.0 | 30 | 60.0 | |
| Regular Exercise | Yes | 49 | 34 | 69.4 | 15 | 30.6 |
| Sometimes | 104 | 61 | 58.7 | 43 | 41.3 | |
| Never | 48 | 25 | 52.1 | 23 | 47.9 | |
| Smoking | No | 124 | 89 | 71.8 | 35 | 28.2 |
| Yes | 77 | 31 | 40.3 | 46 | 59.7 | |
| Blood Pressure (mmHg) | < 140/90 | 114 | 95 | 83.3 | 19 | 16.7 |
| >= 140/90 | 87 | 25 | 28.7 | 62 | 71.3 | |
| Atrial Fibrillation | Regular | 177 | 116 | 65.5 | 61 | 34.5 |
| Irregular | 24 | 4 | 16.7 | 20 | 83.3 | |
| Body Mass Index (BMI) | Ideal | 112 | 59 | 57.9 | 53 | 47.3 |
| Overweight & obesity | 89 | 61 | 68.5 | 28 | 31.5 | |
| Cholesterol | <200 | 89 | 48 | 53.9 | 41 | 46.1 |
| 200-239 | 73 | 51 | 69.9 | 22 | 30.1 | |
| >=240 | 39 | 21 | 53.8 | 18 | 46.2 | |
| Blood Glucose (mg/dL) | <101 | 87 | 70 | 80.5 | 17 | 19.5 |
| 101-199 | 87 | 40 | 46.0 | 47 | 54.0 | |
| >= 200 | 27 | 10 | 37.0 | 17 | 63.0 | |
| Variable | Description |
Coef. (B) |
Odds Ratio |
95% CI Odds Ratio |
P-value | Weighted |
|---|---|---|---|---|---|---|
| Age | <=59 | Ref | - | - | 1 | |
| >59 | 1.541 | 4.670 | 1.367 – 15.953 | 0.014* | 4 | |
| Gender | Female | Ref | 1 | - | - | 1 |
| Male | -0.875 | 0.417 | 0.114 – 1.524 | 0.186 | 2 | |
| Family history of Stroke | No | Ref | 1 | - | - | 1 |
| Yes | 1.200 | 13.484 | 1.087 – 10.144 | 0.035* | 3 | |
| Regular Exercise | Yes | Ref | 1 | - | - | 1 |
| No | 0.512 | 1.669 | 0.536 – 5.197 | 0.377 | 2 | |
| Smoking | No | Ref | 1 | - | - | 1 |
| Yes | 2.174 | 8.791 | 2.364 – 32.696 | 0.001* | 7 | |
| Blood Pressure (mmHg) | < 140/90 | Ref | 1 | - | - | 1 |
| >= 140/90 | 2.602 | 13.484 | 4.868 – 37.354 | <0.001* | 10 | |
| Atrial Fibrillation | Regular | Ref | 1 | - | - | 1 |
| Irregular | 2.167 | 8.731 | 1.999 – 38.127 | 0.004* | 7 | |
| Body Mass Index (BMI) | Ideal | Ref | 1 | - | - | 1 |
| Overweight & obesity | -1.433 | 0.239 | 0.085 - 0.668 | 0.006* | 4 | |
| Cholesterol | <200 | Ref | 1 | - | - | 1 |
| >=200 | -0.922 | 0.398 | 0.150 – 1.054 | 0.064 | 3 | |
| Blood Glucose (mg/dL) | <101 | Ref | 1 | - | - | 1 |
| 101-199 | 1.937 | 6.940 | 2.295 – 20.989 | 0.002* | 6 | |
| >= 200 | 2.471 | 11.830 | 2.409 – 58.090 | <0.001* | 9 |
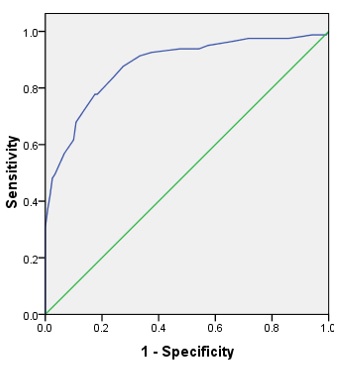
Receiver operating curve for the Stroke Risk Score model. The area under the curve is 0.87 (95% CI: 0.83 – 0.92). The AUC measures the score's discriminatory strength, with values closer to one suggesting greater prediction performance.
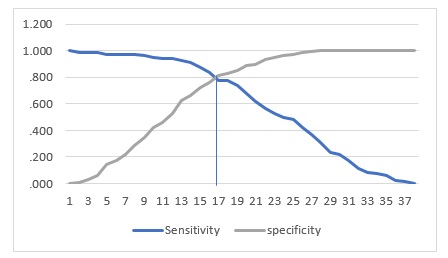
Cut-off of stroke predicting score. Pre-defined cut-off of stroke predicting score of 25.5 would capture 0.77 sensitivity and 0.81.
Fig. (1) demonstrates the receiving operating curve from the population that we included in the study. The area under the curve [AUC] was 0.87 [95% CI: 0.83 – 0.92]. The AUC measures the discriminatory strength of the score, with values closer to one suggesting greater prediction performance. An AUC of 0.87 in our analysis implies that the stroke predicting score offers a good discriminatory ability, with a relatively high probability of correctly discriminating between individuals who are likely to have a stroke and those who may not. This demonstrates that the score has the potential to assist in stroke risk assessment and early prevention. Pre-defined cut-off of stroke predicting score of 25.5 would capture 0.77 sensitivity and 0.81 specificity, as shown in Fig. (2).
4. DISCUSSION
In our model, hypertension was the highest risk factor among the others. Several studies have investigated the association between hypertension and the risk of stroke since it is a well-known stroke risk factor [12-14]. A study by Turin (2016) found that people with hypertension stage two or higher had a significantly higher lifetime risk of stroke than people with hypertension stage one [15]. Another study also mentioned that women are more likely to have a stroke at any level of hypertension [16]. Further research revealed that patients with atrial fibrillation who had hypertension for a longer period of time had a higher chance of having an ischemic stroke [17]. Hypertension may increase the incidence of other medical diseases that are also risk factors for stroke, such as diabetes and heart disease. Therefore, hypertension poses a serious risk for stroke, and lowering blood pressure through the consumption of drug anti-hypertension and a change in lifestyle can contribute to a decreased risk of the condition.
The other significant risk factor which increases the risk of stroke in our study was diabetes. Patients who had been diagnosed with diabetes were most likely to have a significantly increased risk of stroke. A previous study has reported how diabetes increases the risk of stroke [18]. Diabetes was only significantly associated with 1-year stroke recurrence and poor outcome in the small-artery occlusion subtype of minor stroke. This study indicates that diabetes is a risk factor for stroke, particularly for certain subtypes. High blood glucose might damage blood vessels and increase the risk of plaque blocking the blood flow in the brain, causing a stroke [19]. To reduce the risk of stroke, it is essential to effectively manage diabetes and its associated risk factors. This may involve lifestyle modifications, such as a healthy diet and regular exercise, as well as medications to control blood sugar levels, blood pressure, cholesterol, and their associated risk factors. This may include dietary and exercise modifications, as well as medications to control blood sugar, blood pressure, and cholesterol levels.
Smoking was also found to significantly increase the risk of stroke in our study. A previous study also reported that cigarette smoking was found to increase the risk of stroke, and this risk increased with the number of cigarettes smoked in the Chinese population [20]. A study by Hankey (1999) reported that up to one-fourth of all strokes were caused by or linked to cigarette smoking, which increases the relative risk of stroke by approximately threefold. The risk is proportional to the number of cigarettes smoked, is consistent across all subtypes of stroke, and is greatest for subarachnoid haemorrhage and cortical ischemic stroke resulting from arterial other thromboembolism [21]. The result of the previous study was confirmed by a recent meta-analysis that investigated the association of smoking with the risk of stroke in the Asian population and found smoking to be significantly associated with haemorrhagic stroke compared to ischemic stroke [22].
The finding of an odds ratio of 0.23 for the correlation between obesity and stroke risk contradicts the established study and underscores the intricacy of obesity's influence on health outcomes [23, 24]. This result, albeit compelling, needs further investigations involving larger and more diverse samples. Clinicians and researchers must regard such findings with caution and emphasize thorough risk evaluations in stroke prevention initiatives. However, another study found that people with normal to low BMI had a risk of increased low-density lipoprotein with consumption of a low-carbohydrate diet [25]. The risk factor of stroke is high in people who have metabolic problems rather than body weight alone [26, 27]. Therefore, metabolic problems and carbohydrates need further investigation.
There are some studies that have developed a stroke risk score for the Indonesian population [13, 28]. A study by Jusuf in 2016 developed a model of infarction stroke in the Indonesian population [13]. The study included 310 samples (155 cases and 155 controls). The study identified several variables of risk factors, including systolic blood pressure, diastolic blood pressure, triglyceride levels, stroke history, hypertension history, dyslipidemia history, vegetable consumption, sleep duration, snoring, workouts, and emotional stresses. However, this study could not provide enough information on the accuracy of the model in predicting stroke. Another study in Indonesia used machine learning algorithms to predict cerebrovascular events, including stroke [28]. The prediction model of the study was developed using a combination of uncontrollable and controllable factors, such as medical risk factors and lifestyle factors. However, these two studies did not provide information on the accuracy of the model. Therefore, our study could serve as a completed model where the specificity and sensitivity of the model in predicting stroke were carried out.
The stroke risk scoring system should be user-friendly for both healthcare practitioners and the general population. In clinical practice, it could be put into an electronic health system (EHS) so that doctors could quickly screen patients during checkups and flag patients who are particularly susceptible to such health issues [29]. The score could also be put in mobile health apps or web pages so that people can assess their own risk and try to do something about it. In addition, the risk score can be used by the healthcare system to plan other measures, such as preventive lifestyle and medical treatment changes for those at risk. Further studies should aim to improve ease of use, ensure these systems are valid from all sides, and increase the utility of the healthcare system by incorporating the tools into day-to-day processes.
There are a few limitations to this study. As this is a cross-sectional study, it could not explain the causal relationship between variables. Some of the data were self-reported, which may introduce recall bias. Moreover, since the sample was only collected from RSPON, the results cannot be generalized to other settings. While we did account for confounding factors, there may still be residual confounding we could not avoid. These issues could be addressed with a longitudinal study design, which should be the focus of future research.
CONCLUSION
We have developed a regression model for predicting the risk of stroke by focusing on the information on risk factors that can be easily obtained from the primary care setting in Indonesia. The stroke predicting score model has the ability to distinguish between high and low risk of having a stroke; however, further validation must be warranted in larger populations and settings. The four most important high-risk factors for predicting the score from our study are hypertension, diabetes, smoking, and irregular heartbeat. However, there are also other risk factors that are considered in predicting stroke, such as BMI, age, and family history of stroke. Thus, this stroke risk score could be used as a tool for preventive stroke measures.
AUTHORS’ CONTRIBUTIONS
The authors confirm their contribution to the paper as follows: Study conception and design were contributed by TWT; data collection was contributed by TWT and HRY; analysis and interpretation of results were contributed by TWT, RAC, and HRY; and the manuscript was drafted by RAC. All authors reviewed the results and approved the final version of the manuscript.
LIST OF ABBREVIATIONS
| WSO | = World Stroke Organization |
| NCD | = Non-communicable Diseases |
| BMI | = Body Mass Index |
ETHICS APPROVAL AND CONSENT TO PARTICIPATE
This study was approved by the ethical committee of National Brain Centre Hospital, Indonesia, with No. LB.02.01/KEP/064/2021.
HUMAN AND ANIMAL RIGHTS
All procedures performed in studies involving human participants were in accordance with the ethical standards of institutional and/or research committee and with the 1975 Declaration of Helsinki, as revised in 2013.
CONSENT FOR PUBLICATION
All participants willingly gave their informed consent to take part in the study.
AVAILABILITY OF DATA AND MATERIALS
The data supporting the findings of this article is available in the Zenodo Repository at https://doi.org/10. 5281/zenodo.15009884.
FUNDING
This study was funded by DIPA Health Polytechnic Jakarta I year 2022, number LB.02.02/4.3/0790/2020, Ministry of Health of The Republic of Indonesia.
ACKNOWLEDGEMENTS
Declared none.