All published articles of this journal are available on ScienceDirect.

Predictive Factors Affecting Severe Computer Vision Syndrome among Support Staff at Universities in Lampang, Thailand
Abstract
Background
Computers have become essential components of technology in the workplace. Therefore, the prevalence of Computer Vision Syndrome (CVS) caused by interaction with computer screens has grown significantly. Prolonged work at a computer without adequate preventive measures can intensify its effects. This study aims to investigate the association between predictive factors and severe CVS among university support staff.
Methods
This analytical cross-sectional study was conducted with 160 university support staff. Participants were categorized into non-severe and severe CVS groups using self-administered questionnaires. The data were analyzed by multivariable logistic regression.
Results
The study findings revealed that 37.5% of participants experienced severe CVS. Certain characteristics were found to increase the risk of severe CVS: working on a computer for more than five hours per day (OR = 3.01, p = 0.048), time spent staring at a screen for ≥ 60 minutes (OR = 2.39, p = 0.024), tablet use (OR = 2.14, p = 0.042), and dry eyes (OR = 2.97, p = 0.004), with an area under the ROC curve (AuROC) of 75.54%.
Conclusion
The findings of this study suggest that four predictive factors of severe CVS could be used to develop an assessment system for forecasting and monitoring early severe CVS, potentially helping to reduce disease severity. Additionally, these findings could assist organizations in identifying risks and providing effective guidance for managing health issues related to computer use among staff.
1. INTRODUCTION
During the COVID-19 pandemic, most governments ordered residents to stay at home, causing an unprece- dented impact on internet technologies and economies worldwide. This led to a surge in internet traffic and the use of teleconferencing platforms. Information technology, particularly the internet, continues to be crucial in the post-pandemic era, with innovations driving increased usage. With meetings moving entirely online, office work transitioning to employees’ homes, and new work patterns evolving, employees are becoming accustomed to the new “normal.” Most organizations, whether in industry, society, or government, have experienced such shifts [1].
An excessive amount of time spent staring at a computer is a necessity for many office workers, potentially causing significant eye strain. Computers are now used in every office, greatly increasing productivity and simplifying daily tasks. Nowadays, a computer is an essential piece of equipment for both home and business. A Personal Computer (PC) is the most common type, but the term can also refer to other compact computers, such as laptops, tablets, or smartphones [2]. However, with higher workloads and longer hours, computer users are exposed to new, potentially hazardous working conditions [3]. Recent reports indicate that visual and ocular problems are the most prevalent health issues among computer users.
Computer Vision Syndrome (CVS) refers to a group of eye and vision problems caused by prolonged close-up tasks performed on or while using a computer. It is characterized by visual symptoms that arise from exposure to the computer display or its surroundings [4]. The main ocular complaints reported by employees include eye strain, discomfort, burning sensations, redness, blurred vision, and double vision. Most of these symptoms are likely to recur and worsen in the future if no preventive interventions for CVS are implemented [5].
Previous studies have demonstrated a very high prevalence of CVS (99.4%). When classified by the CVS group, these included ocular surface problems (94.7%), eye strain or tired eyes (95.3%), blurred vision (78.1%), and double vision (42.0%). Most reported cases of CVS occurred occasionally and were of minor severity [6]. Eye strain and restlessness were found to be strongly associated with increased screen time [7], as were physical risks, such as neck, shoulder, and back pain [8]. Although the symptoms reported by patients tend to be generally consistent across studies, there are variations in the criteria used to determine when a participant is considered symptomatic [9].
The root cause of CVS is complex, with symptoms linked to multiple factors. Survey questionnaires may be used to collect and filter data, which can then be exported for further analysis [10]. Eye injuries and vision problems in the workplace can impose significant financial costs on businesses, affecting organizational efficiency and productivity. CVS significantly reduces occupational productivity and negatively affects quality of life by placing stress on physical health. Therefore, effective strategies are needed to reduce the impact of CVS on computer users’ productivity, efficiency, and well-being [11].
Undiagnosed and uncontrolled eye disorders among employees have significant financial implications for both employers and society. Direct and indirect costs associated with vision problems—such as medical expenses, absenteeism, and decreased productivity—place a considerable financial burden on businesses [12].
Severe CVS is defined as experiencing more than seven symptoms or at least one symptom that persists even after a brief break and requires treatment. The symptoms are classified into four categories: internal ocular symptoms (such as strain and ache), external ocular symptoms (including dryness, irritation, and burning), visual symptoms (such as blurred or double vision), and musculoskeletal symptoms (including neck and shoulder pain).
Predictive factors associated with severe CVS were analyzed in this study to assess their effectiveness in identifying the likelihood of severe CVS among office workers. This study aims to evaluate personal and work-related factors to identify predictive indicators of severe CVS. These indicators may help forecast the severity of CVS in office workers, assisting employees in recognizing risks and providing guidance on managing potential health issues related to computer use. Additionally, the findings are expected to contribute to the development of workplace hazard control guidelines.
2. MATERIAL AND METHODS
2.1. Study Design and Data Collection
This analytical cross-sectional study was conducted from March to April 2024 at government universities in Lampang, Thailand, where similar management patterns and support staff functions were observed. Participants had been using computers for at least one year in their jobs or had at least one year of experience in a similar type of work.
The sample was divided into two groups to detect differences between them. The sample size for this study was calculated using statistical software. The study size estimate included data from a previous study [13], which reported that the proportion of females with the highest median CVS score was 34.6%, while a pilot study indicated a female proportion of 71.05%. The test was two-sided, with a significant level (alpha) of 5% and a power of 90%. The sample size ratio was 5:1, with 130 participants categorized as having mild to moderate CVS, while 26 participants had severe CVS, resulting in a total sample of 156, rounded up to 160 participants. However, the study’s sampling limitation, focusing on government universities in Lampang, Thailand, restricts its generalizability to other areas, private institutions, and different work contexts. The recruitment process, involving random sampling from collaborating organizations, may not eliminate selection bias.
The participants consisted of support staff working at several government universities. The questionnaire was distributed by the researchers, who conducted a random sample selection from the collaborating organizations. Before being interviewed, each participant was briefed on the study’s purpose. Data were collected through self-reported questionnaires, with participants encouraged to respond honestly and at their convenience.
Participants were classified into two groups using criteria modified from the questionnaire on symptoms following the use of electronic devices, based on a Likert scale according to Ranasinghe and CVS-Q [9, 14]. The severe CVS group consisted of participants who experienced severe symptoms requiring medical attention. The non-severe CVS group included participants who exhibited transient CVS symptoms, lasting from a few minutes to a few hours or persisting for a few hours before fading after rest or sleep.
2.2. Questionnaire Design and Validity
The CVS questionnaire, developed through a review of previous literature, comprised three parts. Part 1 focused on personal factors and behaviors related to the use of communication tools, with 18 questions covering age, gender, eye disease, and the use of contact lenses or eyeglasses. Part 2 addressed work characteristics and behaviors while working, with 12 questions on occupational factors, including the duration of employment and average time spent on a computer each day, as well as computer-related factors, such as display brightness and resolution. Part 3 assessed the severity of CVS, with 12 symptoms rated on a Likert scale with four levels of severity, ranging from 0 to 3, as follows [15-17]:
- 0 = No symptoms
- 1 = Transient symptoms lasting from minutes to hours
- 2 = Symptoms remaining for a few hours and disappearing after rest or sleep
- 3 = Symptoms persisting throughout a break and indicating the need for medical attention
The maximum score of 3 represented the most severe symptoms and was used to identify the severe group, while a score of 0–2 indicated mild or moderate symptoms, thereby placing individuals in the non-severe group based on the established criteria, modified according to Ranasinghe [14]. The participants, based on their symptoms, were as follows:
2.2.1. Non-severe CVS
Participants with mild to moderate symptoms that subsided after a short period of rest.
2.2.2. Severe CVS
Participants who reported experiencing more than seven symptoms or at least one symptom persisting even after taking a short break.
The questionnaire was validated by three professionals with backgrounds in nursing, occupational health, and public health. Item Objective Congruence (IOC) was applied to verify and revise the questionnaire. The validity of the questionnaire was further confirmed through a pilot study involving 30 participants in relevant conditions. Reliability was calculated using Cronbach’s alpha, yielding a result of 0.84.
2.3. Statistical and Data Analysis
The statistical analysis and calculations were performed using Stata/SE 12.1 statistical software. Descriptive statistics were used to summarize independent variables, including demographic characteristics, personal factors, working factors, and computer-related factors, to analyze the prevalence of CVS.
The identification of predictors was conducted through an analysis of significant indicators (odds ratios) using multivariable logistic regression.
3. RESULTS
A total of 160 questionnaires were obtained. In terms of sociodemographic characteristics, the staff were mainly women (70%), with a mean age of 40 years or younger (61.88%). The behavior of the participants regarding the use of communication tools and their working profiles are shown in Table 1.
3.1. Prevalence of Computer Vision Syndrome (CVS)
The participants were identified as having at least one of the symptoms listed in the CVS questionnaires. The results showed that worsening vision (17.5%) was the most common symptom in the severe group, followed by headache (13.75%) and eye burning (13.13%). The demographic characteristics of the 160 support staff participants are shown in Table 2.
| Variables | No. of participants (n) | % |
|---|---|---|
| Demographic | ||
| Gender | ||
| Female | 112 | 70 |
| Male | 48 | 30 |
| Age (years) | ||
| ≤ 40 | 99 | 61.88 |
| > 40 | 61 | 38.13 |
| Refractive Errors | ||
| Normal | 47 | 29.38 |
| Abnormal | 113 | 70.62 |
| Refractive errors corrected | 91 | 56.88 |
| Eye disease | ||
| Dry eyes | 64 | 40 |
| Glaucoma | 2 | 1.25 |
| Cataract | 1 | 0.63 |
| Pinguecula | 9 | 5.63 |
| Communication device | ||
| Smartphone | 160 | 100 |
| Tablet | 56 | 35 |
| Notebook | 66 | 41.25 |
| Desktop PC | 7 | 4.38 |
| Amount of time spent staring at a screen | ||
| ≥ 60 minutes | 89 | 55.63 |
| < 60 minutes | 71 | 44.38 |
| Working profiles | ||
| Work period (years) | ||
| 1–10 | 74 | 46.25 |
| 10–20 | 65 | 40.63 |
| > 20 | 21 | 13.13 |
| Job characteristics (working with computers) | ||
| Almost all-day | 68 | 42.5 |
| Mostly | 42 | 26.25 |
| Sometimes | 50 | 31.25 |
| Type of computer | ||
| Desktop PC | 148 | 92.5 |
| Notebook | 15 | 9.38 |
| Other (smartphone) | 9 | 5.63 |
| Number of hours working at a computer per day | ||
| ≤ 5 hours/day | 32 | 20 |
| > 5 hours/day | 128 | 80 |
| CVS symptom | Severity | |||
|---|---|---|---|---|
| None (0) | Mild (1) | Moderate (2) | Severe (3) | |
| n (%) | n (%) | n (%) | n (%) | |
| Eye burn | 29 (18.13) | 62 (38.75) | 48 (30.00) | 21 (13.13) |
| Excessive tears | 68 (42.50) | 62 (38.75) | 24 (15.00) | 6 (3.75) |
| Red eye | 90 (56.25) | 33 (20.63) | 29 (18.13) | 8 (5.00) |
| Eye pain | 26 (16.25) | 61 (38.13) | 53 (33.13) | 20 (12.50) |
| Dry eyes | 59 (36.88) | 48 (30.00) | 40 (25.00) | 13 (8.13) |
| Blurred vision | 32 (20.00) | 67 (41.88) | 44 (27.50) | 17 (10.63) |
| Double vision (diplopia) | 80 (50.00) | 56 (35.00) | 19 (11.88) | 5 (3.13) |
| Difficult to focus | 71 (44.38) | 61 (38.13) | 25 (15.63) | 3 (1.88) |
| Halos around light | 92 (57.50) | 57 (35.63) | 10 (6.25) | 1 (0.63) |
| Worsening vision | 31 (19.38) | 56 (35.00) | 45 (28.13) | 28 (17.5) |
| Headache | 36 (22.50) | 49 (30.63)) | 53 (33.13) | 22 (13.75) |
| Characteristics | Non-severe CVS | Severe CVS | p-value |
|---|---|---|---|
| n (%) | n (%) | ||
| Demographic | |||
| Gender | |||
| Male | 30 (30.0) | 18 (30.0) | 1 |
| Female | 70 (70.0) | 42 (70.0) | |
| Age | |||
| < 40 years | 58 (58.0) | 41 (68.3) | 0.193 |
| ≥ 40 years | 42 (42.0) | 19 (31.7) | |
| Refractive errors of vision | |||
| Myopia | 52 (52.0) | 53 (55.0) | 0.746 |
| Hyperopia | 18 (18.0) | 11 (18.33) | 1 |
| Astigmatism | 21 (21.0) | 20 (33.33) | 0.095 |
| Refractive errors corrected | 54 (54.00) | 30 (50.00) | 0.628 |
| Eye disease | |||
| Dry eyes | 27 (27.00) | 37 (61.67) | < 0.001 |
| Glaucoma | 1 (1.00) | 1 (1.67) | 1 |
| Cataract | 0 (0.00) | 1 (0.63) | 0.375 |
| Pinguecula | 3 (3.00) | 6 (10.00) | 0.081 |
| Communication device | |||
| Phone | 100 (100) | 60 (100) | < 0.001 |
| Tablet | 28 (28.00) | 28 (46.67) | 0.026 |
| Notebook | 37 (37.00) | 29 (48.33) | 0.186 |
| Desktop PC | 4 (4.00) | 3 (5.00) | 1 |
| Amount of time spent staring at a screen | |||
| ≥ 60 minutes | 45 (45.00) | 44 (73.33) | 0.001 |
| < 60 minutes | 55 (55.00) | 16 (26.67) | |
| Working profiles | |||
| Work period | |||
| 1–10 years | 42 (42.00) | 32 (53.33) | 0.21 |
| 11–20 years | 46 (46.00) | 19 (31.67) | |
| > 20 years | 12 (12.00) | 9 (15.00) | |
| Job characteristics (working with computers) | |||
| Almost all-day | 30 (30.00) | 38 (63.33) | < 0.001 |
| Mostly | 29 (29.00) | 13 (21.67) | |
| Sometimes | 41 (41.00) | 9 (15.00) | |
| Type of computer | |||
| Desktop computer | 91 (91.00) | 57 (95.00) | 0.537 |
| Notebook or laptop | 8 (8.00) | 7 (11.67) | 0.576 |
| Other (smartphone) | 8 (8.00) | 1 (1.67) | 0.155 |
| Number of hours working on a computer per day | |||
| ≤ 5 hours/day | 73 (73.00) | 55 (91.67) | 0.004 |
| > 5 hours/day | 27 (27.00) | 5 (8.33) | |
| Risk Predictor |
Odds Ratio (95% CI) |
p-Value |
|---|---|---|
| Dry eyes | 2.97 (1.43, 6.17) | 0.004 |
| Tablet use | 2.14 (1.03, 4.47) | 0.042 |
| Time spent staring at a screen for ≥ 60 minutes | 2.39 (1.12, 5.10) | 0.024 |
| Working on a computer for >5 hours per day | 3.01 (1.01, 8.94) | 0.048 |
3.2. Characteristics of the Samples in the Two Groups
The participants were categorized into two groups: non-severe (n = 100) and severe (n = 60), based on the established criteria. Different characteristics were observed between the groups, as shown in Table 3.
3.3. Factors Associated with Severe CVS
According to the univariate analysis presented in Table 3 , several factors were identified as potentially significant in relation to CVS. These include refractive errors, presence of eye disease, type of communication devices used, duration of device use, screen time, job characteristics (specifically, working with computers), and the number of hours spent working on a computer per day.
Cut-off points were established based on the statistical or clinical significance of continuous variables.
The predictors were identified by analyzing the significant indicators associated with severe CVS. The odds ratio (OR) or p-value < 0.05 for each predictor was
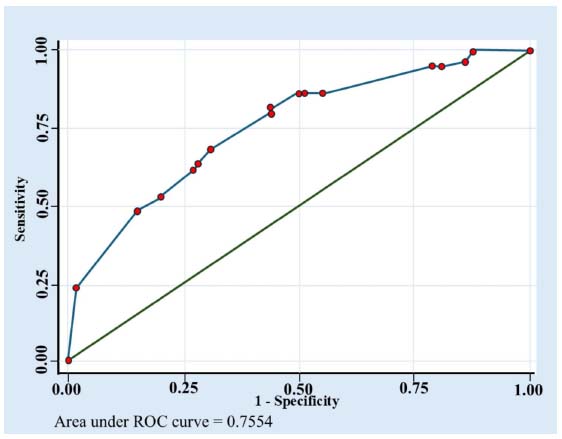
then selected. Under multivariable analysis, several characteristics were found to increase the risk of severe CVS in this study: working on a computer for more than five hours per day (OR = 3.01, 95% CI [1.01–8.94], p = 0.048), tablet use (OR = 2.14, 95% CI [1.03–4.47], p = 0.042), time spent staring at a screen for ≥ 60 minutes (OR = 2.39, 95% CI [1.12–5.10], p = 0.024), and dry eyes (OR = 2.97, 95% CI [1.43–6.17], p = 0.004), as shown in Table 4.
According to the results of the multivariate analysis, four variables can be used to predict the severity of CVS. Additionally, an area under the curve of 75.54% is considered an acceptable criterion, as shown in Fig. (1).
4. DISCUSSION
Regarding the characteristics, health status, and communication tool usage of the severe CVS group, the findings of this study revealed that the majority were female, consistent with previous studies [18-20]. Most participants were under 40 years old, had refractive errors, and suffered from eye diseases (such as dry eyes) associated with CVS. Dryness, burning, grittiness, or heaviness after prolonged periods of computer use may be caused by ocular surface disorders. Similarly, a study by Samuel et al. found that the most frequent moderate to severe symptoms among university administrative staff were burning sensation, foreign body sensation, eye pains, itching, and blurred vision [21].
Environmental factors such as dry, air-conditioned interiors, drafts from ventilation fans, static buildup, airborne paper, and typical office dust have been shown to impact ocular surface symptoms [ 22 ]. Studies have linked indoor conditions—including air conditioning, low humidity, and airborne particles—to dry eye disease (DED). Furthermore, research indicates a correlation between exposure to indoor air contaminants, such as volatile organic compounds and particulate matter, and increased eye irritation and discomfort [ 23 ].
Additionally, over half of the participants reported spending more than 60 minutes staring at screens for non-work-related purposes, which is consistent with previous studies on the background factors and health status associated with CVS [ 24–26]. Besides mobile phones, tablets were the most commonly used communication devices. Participants frequently reported a range of ocular symptoms and visual impairments associated with screen use. CVS encompasses a group of visual and extraocular symptoms resulting from prolonged use of visual display terminals [27].
The most commonly reported symptoms included dry eyes, headaches, and back pain, with findings indicating that longer employment duration and the presence of pre-existing eye conditions were significantly associated with severe CVS [ 28, 29]. Furthermore, a statistically significant correlation was observed between the amount of time spent on computers and the occurrence of vision disorders.
Among the serious symptoms, the most prevalent complaint stated by respondents was impaired eyesight, followed by headaches, eye burning, eye pain, and dry eyes. These results were similar to that revealed in previous research, with participants rating blurred or double vision, difficulties focusing, dry eyes, eye fatigue, and headaches higher than other symptoms [30]. According to the most common symptoms reported by office workers using computers, the duration of employment and the prevalence of pre-existing eye diseases were strongly associated with the occurrence of severe CVS [17]. Participants were exposed to screens for more than five hours per day. These findings were slightly lower than those reported by Charlotte and Thabisile, who revealed that the majority of participants used a computer for 7–8 hours per day [31]. Additionally, those who used two or three electronic devices were identified as having CVS, with the prevalence being greater among smartphone and laptop users [32]. According to Dulnério et al., in addition to computers, smartphones, and tablets also pose a high risk of developing CVS [33].
The aim of this study was to evaluate the predictive factors associated with the highest likelihood of severe CVS among university support staff. The predictive factors were assessed for discrimination using the AuROC curve, revealing it to be at a significant level. It showed good discriminative ability for developing and validating datasets [34]. Mekuriaw et al. used multivariate analysis to identify characteristics predictive of computer vision syndrome. Age and working hours at the computer per day were found to be independently associated with CVS [35]. The predictive factors were based on data received directly from participants. The identification of predictive factors may help to indicate the possibility of severe CVS occurrence. Similarly, Mekonnin et al. found that an increase in the average time spent on the computer per day was a predictor of CVS among university secretaries [36]. However, the results of this present study identified three factors that differed from previous research. These differences may be attributed to variations in individual and job characteristics. Although the proposed model may be useful for monitoring occupational health programs to manage preventive eye care, there is more to learn about the signs indicating severe CVS. Some signs of advanced illness potentially helpful as predictive indicators have been identified through epidemiologic investigations. Although the results of formal decision analyses can be applied at the bedside, they are more commonly derived from the literature, primarily to support health management decision-making [37].
5. LIMITATIONS
Since this study was carried out at government universities, its applicability to other areas, private establishments, or workplaces may be limited. Selection bias might not be eliminated by the recruitment approach, which included random samples within cooperating organizations. This study collected data on refractive vision errors and ocular diseases, but further research is needed to determine whether participants had pre-existing eye conditions before their use of computers. This would help clarify the factors contributing to severe CVS. Moreover, environmental parameters, such as office lighting, air quality, air conditioner use, indoor air pollutants (such as particulate matter and volatile organic compounds), and ocular irritation and discomfort were not monitored in this study. Consequently, the elements listed as contributing to CVS may offer a more thorough understanding of possible hazards. Therefore, future research should focus on samples from diverse settings, the investigation of pre-existing eye issues in participants prior to computer use, and the monitoring of environmental factors.
CONCLUSION
Work patterns have changed over time due to the increasing use of computers in the workplace. It is widely recognized that prolonged screen use can impair vision, a disorder known as Computer Vision Syndrome (CVS). The findings of this study revealed that university support staff have a high prevalence of CVS. Following the categorization of the participants into severe and non-severe groups, these risk variables were found to affect the incidence of severe CVS. Significant predictors of severe CVS in this study included working on a computer for more than five hours per day, tablet use, screen time of 60 minutes or more, and dry eyes.
These factors were associated with a predictive accuracy of 75.54%, suggesting their potential utility in developing a scoring system for early CVS detection and monitoring. Furthermore, the implementation of occupational health initiatives focusing on eye care may help employees recognize and mitigate these risks. Lastly, this study offers valuable insights into the health implications of prolonged screen exposure and contributes to the development of workplace hazard control strategies.
AUTHORS’ CONTRIBUTIONS
T.T, C.C, and S.P: Study conception and design; T.T, C.C, and S.P: analysis and interpretation of results; T.T and S.P: draft manuscript: All authors reviewed the results and approved the final version of the manuscript.
LIST OF ABBREVIATIONS
| PC | = Personal computer |
| CVS | = Computer vision syndrome |
| AuROC | = Area under the ROC curve |
| AuROC | = Area under the ROC curve |
| DED | = Dry Eye Disease |
ETHICS APPROVAL AND CONSENT TO PARTICIPATE
The study received ethics clearance from the Human Research Ethics Committee of Thammasat University (Science) Thailand, to conduct this study (No. 66PU172).
HUMAN AND ANIMAL RIGHTS
All procedures performed in studies involving human participants were in accordance with the ethical standards of institutional and/or research committee and with the 1975 Declaration of Helsinki, as revised in 2013.
CONSENT FOR PUBLICATION
Informed consent with voluntary participation was obtained from the participants.
AVAILABILITY OF DATA AND MATERIAL
All data generated or analyzed during this study are included in this published article.
ACKNOWLEDGEMENTS
The authors would like to thank the Faculty of Public Health at Thammasat University for providing the research facilities. They would also like to dedicate the entire value of this research to all the university support staff who participated.