All published articles of this journal are available on ScienceDirect.

Study of the Impact of Economic Factors and Healthcare System Capacity on the Elderly Population in Morocco: A Health Economics Perspective
Authors Info & Affiliations
Abstract
Introduction
This study examines the interplay between economic factors (Gross Domestic Product growth, inflation, unemployment) and healthcare capacity (hospital beds, health expenditures) in shaping Morocco’s aging population dynamics. With rapid demographic aging (projected to reach 23.2% by 2050), the research aims to identify policy levers for sustainable social protection and improved elderly well-being.
Methods
We employed an ARDL model on annual data (1990-2023) to analyze short- and long-term relationships. Key variables included the elderly population proportion, economic indicators, and health system metrics. Stationarity (ADF, PP, KPSS tests) and cointegration (bounds testing) were verified, with diagnostic checks (Breusch-Godfrey, Jarque-Bera, CUSUM) ensuring robustness.
Results
Results confirm a long-term cointegration relationship, with economic growth (β = 0.32, p < 0.01) and health investments (β = 0.18, p < 0.05) positively influencing elderly well-being, while inflation (β = −0.41, p < 0.01) and unemployment (β = −0.27, p < 0.05) exacerbate vulnerabilities. The error correction term (ECT = −0.145) indicates a 14.52% annual convergence toward equilibrium. Short-term dynamics reveal immediate negative effects of inflation and lagged unemployment impacts.
Discussion
The results show economic growth and health investments boost elderly well-being, while inflation and unemployment worsen vulnerabilities. Slow equilibrium convergence highlights structural rigidities requiring proactive policies. Hospital beds show mixed effects, suggesting delayed demographic impacts. Integrated policies are crucial to address fiscal pressures from aging, considering Morocco’s regional disparities and informal labor market.
Conclusion
The study underscores the need for integrated policies: (1) expanding healthcare infrastructure, (2) stabilizing inflation and unemployment, and (3) promoting intergenerational equity. Proactive measures—such as incentivized fertility policies and efficient health spending—are critical to mitigate aging-related fiscal pressures. Limitations include data granularity, suggesting future micro-level analyses.
1. INTRODUCTION
The accelerated aging of Morocco's population (5 million people aged 60 and above in 2024 vs. 3.2 million in 2014 [1]) requires proactive, evidence-based public policies. These policies prioritize the sustainability of social protection and health systems, facing increasing pressure from an average annual growth of 4.6% in the +65-year-old group, which is five times greater than the overall population growth (0.85%). A multidimensional approach, including structural reforms and intergenerational equity mechanisms, is essential to address the specific needs of this aging population while mitigating socioeconomic risks linked to below-replacement fertility (1.97 children/woman in 2024 vs. 2.1 [2].
Economic growth, unemployment, and inflation are key indicators influencing a state’s ability to meet the needs of an aging population [3, 4]. Economic growth, measured by GDP, is a fundamental driver of financial stability and overall quality of life for a population, especially elderly individuals. States with high GDP can allocate more resources to healthcare, social assistance, and pensions, better addressing citizens' specific needs [5, 6]. Thus, a low unemployment rate helps secure funding for healthcare and pension systems, fostering an environment conducive to the well-being of older adults. However, labor market dynamics directly impact this population [7]. High unemployment increases pressure on public resources, potentially reducing access to key services and healthcare for older adults [8, 9]. Thus, inflation directly impacts older adults, particularly those reliant on fixed incomes, by increasing the cost of essential services, thus compromising their financial stability [10, 11]. However, controlled inflation can improve access to medical care for this demographic, contributing to better overall health outcomes. This phenomenon also increases their proportion within the population, highlighting the key role of economic regulation in health and demographic dynamics [12, 13]. Bed capacity is a key indicator for healthcare systems and is crucial for optimal patient care, particularly for older adults requiring increased medical attention [14]. A lack of adequate bed capacity results in extended waiting periods and diminished care standards, adversely affecting patient health outcomes. Additionally, the portion of GDP allocated to health influences results, and increased investment fosters preventive measures, effective treatment, and enhanced well-being for older adults. Countries allocating a larger proportion of GDP to health are better equipped to meet the needs of aging populations, increasing their demographic portion [3].
Chronic diseases represent a substantial share of healthcare expenditures globally, constraining governments' capacity to invest in broader public health initiatives or infrastructure [15]. Morocco is experiencing rapid demographic aging, with the population aged 60 and over expected to increase from 12.2% to 23.2% by 2050 [1], alongside a high prevalence of chronic diseases affectingmore than 50% of older adults [16]. Although the Medical Assistance Scheme for the economically disadvantaged (RAMED) and Mandatory Health Insurance (AMO) Tadamon ensure 95% medical coverage [17], chronic diseases account for 50% of the health budget, underscoring significant fiscal strain. The 40th National Medical Congress called for urgent structural reforms, including adjusted care tariffs, to sustain the healthcare system amid aging demographics. Research has focused on two interdependent indicators: economic parameters and healthcare infrastructure performance. These metrics are vital for addressing aging-related challenges and ensuring equitable healthcare access.
This operational dyade deciphers the underlying mechanisms of health challenges linked to aging while providing an analytical framework for targeted interventions. The research question is as follows: In the context of a rapidly aging population, how do economic factors—such as GDP growth, unemployment, and inflation—interact with healthcare system capacities— including hospital infrastructure and health expenditures —to shape the proportion of the population aged 65 and over? Furthermore, what integrated public policies can be designed and implemented to ensure the sustainability of social protection systems while enhancing the quality of life for older adults? Unlike previous studies that often examined these elements in isolation, this research adopts a holistic approach by exploring the interconnections between these factors. This study aims to develop more operative strategies to address population aging and anticipate future challenges. With quantitative methods, this study reveals complex and dynamic interactions among economic, health, and social factors that shape population aging. The results highlight the need for combined public policies to address aging demographic challenges and improve seniors' quality of life. By linking these two dimensions, this study provides a deeper understanding of the interactions shaping demographic trends and the well-being of older adults.
2. LITERATURE REVIEW
2.1. Economic Factors Influencing Social Security
Numerous studies have highlighted the relevance of applying normative economics and general equilibrium theory to the social and health sectors [18-21]. These approaches leverage methods such as social welfare optimization for allocating scarce resources, Walrasian modeling incorporating externalities and information asymmetries, and cost‒utility analysis maximizing Quality-Adjusted Life Years (QALYs) under budget constraints. Rooted in a neo-Walrasian perspective, these frameworks view the state as a partial planner and employ computable general equilibrium models to assess the redistributive impact of health policies. Demographic economics further enriches this analysis by linking population dynamics to socioeconomic development [22]. While Malthusian theories emphasized resource constraints, modern endogenous models highlight economic incentives and social norms in fertility and migration decisions [22, 23]. Demographic shifts now shape—and are shaped by—labor markets, productivity, and long-term growth [8], with fertility increasingly driven by socioeconomic factors and policy interventions [24]. Structural, long-term perspectives are critical to capture these complex interactions [22]. These theoretical approaches provide an analytical framework for examining the influence of macroeconomic variables, such as GDP [25], unemployment rates [26], and inflation [27], on the performance and efficiency of healthcare systems.
Inflation is a sustained and generalized increase in the prices of goods and services within an economy over a given period [28]. Population aging and continuous technological advancements drive cost inflation in healthcare systems, necessitating strategic resource allocation [29]. Several studies have highlighted a significant relationship between inflation and demographic dynamics, with the population aged 65 and over being most affected by inflation [30, 31]. This phenomenon reduces the purchasing power of older adults relying on fixed incomes, such as pensions and savings [32, 33], exacerbating their vulnerability due to several consequences, including rising healthcare expenditures [34], which in turn increases the demand for public services.
Thus, economic growth, measured by GDP—an economic aggregate that quantifies the total economic output of a country [35]—plays a critical role in societal well-being. The wealth generated is significantly correlated with the population's standard of living. Countries with highly productive economies possess greater capacity to fund social services and pension systems, ensuring better benefits for their elderly population [36-38]. On the other hand, unemployment represents a major challenge for contemporary economies, particularly due to rapid technological advancements and increasing automation, which are progressively replacing human labor with machines [39]. These trends highlight the need for flexible policy measures to manage economic expansion effectively and mitigate disruptions in the labor market.
Elevated unemployment rates can destabilize economies, limiting the availability of public resources needed to support older adults. Specifically, high unemployment reduces contributions to pension schemes, potentially decreasing pension payouts and hindering seniors' ability to cover essential expenses [40]. It also diminishes government tax revenues, leading to potential cuts in healthcare funding. Moreover, high unemployment places additional financial strain on families, reducing their ability to support elderly relatives and increasing reliance on already strained public services [41]. On the other hand, lower unemployment fosters economic stability, ensuring steady funding for pensions and healthcare, which enhances life expectancy and increases the share of older adults in the population. Consequently, unemployment rates significantly impact the quality of life and well-being of older adults, with ripple effects across pension and healthcare systems [3].
2.2. Healthcare System Capacity and Expenditures: Implications for Aging Populations
Population aging will pose a major challenge in the coming years, profoundly impacting the economy and society [14, 42]. This demographic shift has raised significant economic, sociological, and managerial concerns, compelling public authorities, businesses, and nonprofit organizations to address its implications [43]. Research has explored various aspects of aging, from neurocognitive mechanisms to socioeconomic challenges [14, 44]. The demographic transition model remains a key heuristic framework [45, 46]. The fifth phase is characterized by pronounced population aging, with a high proportion of elderly individuals and an important decline in the youth population. This phase is characterized by fertility rates below the replacement level (≤2.1 children per woman), leading to demographic decline [22]. Examples include Germany, Morocco, Italy, and Japan. This stage generates significant economic, social, and public health challenges, deeply impacting the structure and functioning of society [47].
The ability of healthcare systems to adapt is essential in addressing the rising demands of older adults, who need more medical attention as a result of the growing prevalence of chronic illnesses [14, 48]. The demographic rise of the elderly population has led to mounting pressure on healthcare systems, creating significant structural challenges. An adapted institutional response is therefore crucial to anticipate the specific needs of aging populations and ensure dignified and equitable care [49]. These challenges highlight the interdependence between hospital capacity, the quality of care provided to seniors, and their growing proportion in population statistics [50]. In this context, hospital bed capacity is a key indicator reflecting the quality of care. The number of beds per thousand residents serves as an indicator of a healthcare system's capacity to deliver sufficient and prompt care, a factor that is vital for meeting the health requirements of older adults [51].
Insufficient hospital beds can lead to overcrowding in healthcare facilities, longer wait times for treatment, and a decline in the quality of medical services. These issues not only directly threaten the health of older adults but could also contribute to premature mortality within this population, impacting their demographic weight in the medium term. Conversely, high-bed capacity improves access to care and the health outcomes of seniors, promoting longevity and quality of life and influencing their proportion of the population [52, 53]. On the other hand, a shortage of beds can result in hospital overload, delays, and reduced care quality, jeopardizing the health of older adults and potentially diminishing their demographic share [54].
Health expenditures play a central role in preserving the physical health, daily well-being, and functional autonomy of older adults, highlighting their crucial contribution to the sustainability of healthcare systems facing demographic aging. These expenditures reflect a nation’s societal and political commitment to ensuring equitable access to comprehensive medical services— including active prevention, chronic disease management, and rehabilitation programs—tailored to the evolving needs of this vulnerable population [55]. Health investments play a preventive role in managing the financial burden of aging, particularly by addressing early-stage chronic and age-related conditions, thus curbing dependency costs and supporting an autonomous, socially integrated elderly population. This proactive approach fosters a balanced demographic transition, where longevity aligns with active senior participation in society [56]. Optimal healthcare funding is essential for comprehensive elderly care, enabling specialized medical‒ social structures and home-based support systems. These services preserve seniors’ autonomy and dignity, which are key to successful aging [55]. Conversely, chronic underfunding creates systemic barriers: unequal access to geriatric care, critical treatment delays for degenerative diseases, and a shortage of age-specialized staff [57]. These gaps exacerbate medical complications and social isolation, threatening seniors’ quality of life and reducing healthy life expectancy—a key public policy indicator [58].
3. DATA AND METHODOLOGY
Economic and systemic indicators are selected on the basis of their complementary roles in analyzing resilience to population aging. These indicators shed light on financial constraints and structural challenges, identifying bottlenecks and emerging risks. Their integration guides adaptive reforms, ensuring a balance between healthcare performance, social equity, and economic sustainability amid demographic transition. This study analyzes annual time series data for each variable presented in Table 1 over 34 years from 1990 to 2023 for its empirical findings.
The measured model we have proposed is built on the reviewed literature and is expressed in Equation (1):
| EPP = f(EG, INF, UNEM, HB, HE) | (1) |
The proportion of the elderly population (EPP), defined as the percentage of the total population aged 65 years or older, is a central indicator for analyzing demographic aging and its socioeconomic implications. This study examines the influence of several key independent variables, including EG, which reflects a society’s capacity to support its elderly; inflation (INF), whose impact on seniors’ purchasing power is critical; the unemployment rate (UNEM), which affects pension systems and the integration of older adults into the labor market; the number of hospital beds per 1,000 inhabitants (HB), an indicator of healthcare access; and health expenditures (HE), which play a decisive role in quality of life and active aging. To ensure the robustness of the results, all variables were logarithmically transformed before analysis, reducing heteroscedasticity and linearizing relationships between variables. Additionally, we included the constant coefficient and the error term in equation (1). The model can be expressed in log-linear form as follows:
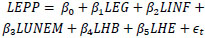 |
(2) |
The ARDL methodology implemented in this study follows established econometric techniques for analyzing cointegrated time series [61, 62]. This method is particularly suitable for analyzing short- and long-term dynamic relationships between variables in a time series framework. It offers the advantage of handling series with mixed orders of integration, provided that none of the regressors are integrated with an order higher than I (1), which is the case in this research. The ARDL model can be specified by the following equation (2):
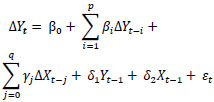 |
(3) |
The dynamic relationship between variables is captured by the ARDL model in Equation (3). Here, the dependent variable at time t is denoted as Yt, while Xt represents the independent variable(s) at the same time. The first-difference operator, denoted as ∆Yt = Yt - Yt-1, captures temporal variations in the series. The model includes a constant, denoted as β0, as well as coefficients associated with the lags of the dependent variable (βi) and independent variable (γj), applied to the terms ∆Yt-i et ∆Xt-j., respectively. The long-term relationship is modeled through the coefficients δ1 et δ2, which weigh the lagged
| Variable | Description | Abbreviation | Data Source |
|---|---|---|---|
| Elderly population proportion | Percentage of the total population aged 65 years and older | EPP | World bank group, national accounts |
| Economic growth | Annual percentage change in GDP | EG | World bank group, national accounts |
| Inflation | Annual percentage change in the Consumer Price Index (CPI) | INF | International monetary fund [59], national accounts |
| Unemployment rate | Percentage of the labor force that is unemployed | UNEM | National accounts |
| Hospital beds per 1,000 People | Number of hospital beds available per 1,000 inhabitants | HB | National accounts, world bank group [60] |
| Health expenditures | Total health expenditure as a percentage of GDP | HE | National accounts |
variables Yt-i et Xt-i. Finally, the error term εt is assumed to follow a white noise process, ensuring the absence of residual autocorrelation in the model. Typically, ARDL analysis proceeds in three steps:
In the initial phase, the stationarity of the variables is assessed via unit root tests, including the augmented Dickey‒Fuller [63], Phillips‒Perron [64], Dickey‒Fuller generalized least squares [65], and NG‒Perron tests [66]. For datasets with limited observations, the NG-Perron test offers greater reliability than alternative unit root tests do ARDL [67].
In the second step of cointegration analysis, Equation (2) is used to construct the ARDL model, which is formulated as Equation (4):
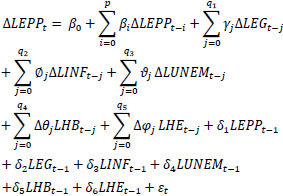 |
(4) |
Where ∆ denotes the first-difference operator; εt represents the noise residuals; and δ1, δ2, δ3, δ4, δ5 and δ6 represent the long-run coefficients. The Akaike information criterion (AIC) determines the appropriate lags for variables p, q2, q3, q4, q5 and q6. The null hypothesis, which posits the absence of cointegration, is tested against the alternative hypothesis to assess whether a long-term relationship exists among the variables:
H0: δ1= δ2= δ3= δ4= δ5= δ6= 0
H1: δ1≠ 0 ∪ δ2≠0∪ δ3≠ 0 ∪ δ4≠ 0 ∪ δ5 ≠ 0 ∪ δ6≠ 0
This study utilizes the Fisher bounds test (F-bounds test) to evaluate the presence of cointegration among variables. The cointegration signifies a long-term relationship, indicating that the variables move together over extended periods despite short-term variations. The short-term dynamics, derived from the error correction model, are outlined in equation (5), which captures the interplay between short-term fluctuations and long-term equilibrium.
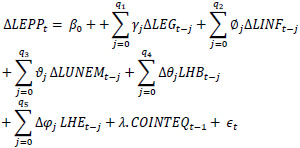 |
(5) |
where the COINTEQt-1 term denotes the rate of return to the long-run equilibrium after a short-run shock.
Third, to evaluate the quality of the model, various diagnostic tests are employed, including analysis of the functional form, detection of serial correlation, verification of residual normality, and examination of heteroscedasticity. One of the fundamental assumptions of the classical linear regression model is that the error term associated with one observation is independent of the error term associated with any other observation. However, when this independence is violated and dependence between error terms is observed, it is referred to as the autocorrelation [68]. This situation can be symbolically represented by the following relationship:
 |
(6) |
where μi and μj represents the error terms for observations i. and j, respectively. Given the advantages of the Breusch‒Godfrey test (also referred to as the LM test) over the Durbin‒Watson test, we utilize the Breusch‒ Godfrey test in this study to detect the presence of autocorrelation in the disturbance term.
A fundamental assumption of the classical linear regression model is that the variance of each disturbance term εi, conditional on the chosen values of the explanatory variables, is a constant equal to σ2 [68]. The assumption of independent error terms in classical linear regression can be violated when autocorrelation exists. This situation can be symbolically represented by Equation (6):
 |
(7) |
For this study, we employ the Breusch‒Pagan‒Godfrey test to check for heteroscedasticity in our disturbance term.
To verify that our model adheres to the assumptions of the classical normal linear regression model, we examine the normality of the disturbance term εₜ using the Jarque-Bera (JB) test. The test statistic is computed as Equation (8):
 |
(8) |
where n is the sample size, S is the skewness coefficient, and k is the kurtosis coefficient. The null hypothesis asserts that the residuals follow a normal distribution. If the p-value associated with the JB statistic is sufficiently low—indicating a significant deviation from zero—the null hypothesis can be rejected. Otherwise, it is retained, suggesting that the residuals are normally distributed.
The stability of model parameters can be assessed using CUSUM and Cumulative Sum of Squares of Recursive Residuals (CUSUMSQ) tests, which examine whether regression parameters remain constant over time [62, 69]. These tests operate under the null hypothesis of parameter stability. These tests are based on the null hypothesis that the regression parameters are stable. This hypothesis is considered valid if the plots of the CUSUM and CUSUMSQ statistics remain entirely within the confidence intervals defined for a significance level of 5%.
4. RESULTS AND DISCUSSION
4.1. Descriptive Statistics
As indicators describing the distribution of the study's data, Table 2 presents descriptive statistics, including the mean, minimum, and maximum values. Descriptive analysis is essential for identifying and describing trends in time series data. The means indicate that the central values of the variables vary significantly, ranging from -0.074 for LHB to 2.550 for LEG. The medians, which are close to the means for most variables (e.g., 0.685 for the LEPP), suggest relatively symmetric distributions, except for the LINF, which shows greater dispersion (standard deviation of 0.869). The extreme values reveal significant variability, particularly for LINF (-1.204--2.078) and LEG (1.037--3.108), whereas LHE exhibits low dispersion (standard deviation of 0.023).
4.2. Stationary Test (PP, ADF, and KPSS)
The results of the unit root test, conducted via the augmented Dickey‒Fuller (ADF), Phillips‒Perron (PP), and KPSS stationarity tests, are presented in Table 3.
Unit root tests (PP, ADF, and KPSS) were employed to assess the stationarity of the time series. At the level of raw data, the results vary across tests. The PP and ADF tests indicate that some variables, such as LEG, are stationary from the outset, whereas others, such as LUNEM and LHE, are not. The KPSS test confirms that certain variables, such as the LEPP and LHE, are not stationary at the level, except LEG, which is stationary according to the KPSS. After differentiation (first-difference), all tests confirm the stationarity of the variables. For example, LINF transitions from t = -3.4873 to t = -10.4737 after differentiation according to PP, and LUNEM becomes stationary according to KPSS. These results indicate that the series are integrated of order 1 (I(1)), a crucial condition for applying cointegration models or valid regressions. These findings justify appropriate transformations to ensure the robustness of subsequent econometric analyses.
4.3. Determination of the Optimal Lag Length
Model selection criteria such as the log-likelihood (LogL), AIC, Bayesian information criterion (BIC), and Hannan-Quinn criterion (HQ), were used to identify the best ARDL model among several specifications (Fig. 1). The ARDL (3,1,2,0,1,3) model has the lowest values for AIC (-7.139), BIC (-6.399), and HQ (-6.898), making it the optimal model according to these criteria [70]. These results align with previous findings in the econometric literature [61], which emphasized the importance of minimizing these criteria to select a robust and parsimonious model. The selection of this optimal ARDL model ensures reliable estimation of both long-term and short-term relationships between variables while avoiding overfitting.
| Descriptive Statistics | LEPP | LEG | LINF | LUNEM | LHB | LHE |
|---|---|---|---|---|---|---|
| Mean | 0.685294 | 2.549559 | 0.623277 | 2.402283 | -0.074066 | 1.948135 |
| Median | 0.685000 | 2.600463 | 0.541241 | 2.368749 | -0.116534 | 1.938738 |
| SD | 0.100430 | 0.396173 | 0.869366 | 0.185561 | 0.130824 | 0.022695 |
| Maximum | 0.830000 | 3.107721 | 2.078191 | 2.760010 | 0.254642 | 2.002830 |
| Minimum | 0.480000 | 1.036737 | -1.203973 | 2.187174 | -0.356675 | 1.922788 |
| Obs | 34 | 34 | 34 | 34 | 34 | 34 |
| Variable | Test PP (Level) | Test PP (1st Diff) | Test ADF (Level) | Test ADF (1st Diff) | Test KPSS (Level) | Test KPSS (1st Diff) |
|---|---|---|---|---|---|---|
| LEPP | t = -3.1300 (**) | t = -5.8867 (***) | t = -2.8674 (*) | t = -5.8722 (***) | t = 0.6774 (**) | t = 0.4358 (*) |
| LEG | t = -8.1858 (***) | t = -38.3257 (***) | t = -8.4894 (***) | t = -4.4904 (***) | t = 0.0998 (n0) | t = 0.5000 (**) |
| LINF | t = -3.4873 (**) | t = -10.4737 (***) | t = -2.4754 (n0) | t = -10.1310 (***) | t = 0.3994 (*) | t = 0.5000 (**) |
| LUNEM | t = -1.7142 (n0) | t = -6.8681 (***) | t = -1.7198 (n0) | t = -6.8769 (***) | t = 0.5667 (**) | t = 0.1706 (n0) |
| LHB | t = -3.1502 (**) | t = -6.4133 (***) | t = -2.8821 (*) | t = -5.6282 (***) | t = 0.4092 (*) | t = 0.2787 (n0) |
| LHE | t = 3.0631 (n0) | t = -4.5664 (***) | t = 1.9321 (n0) | t = -4.5710 (***) | t = 0.7178 (**) | t = 0.6611 (**) |
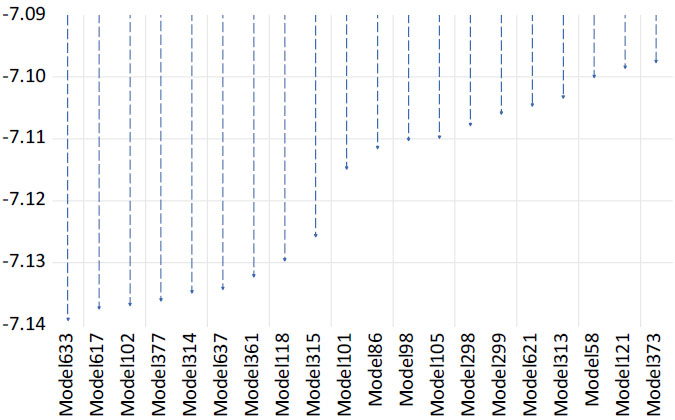
Akaike information criteria (top 20 models).
4.4. Bound Testing
The ARDL cointegration test (bounds test) was employed to verify the existence of a long-term relationship between the variables. The calculated F-statistic (6.459746) is compared with the critical values for a model with a restricted constant trend (Case 2) as established in the econometric literature [62]. Since the F-statistic exceeds the critical values at all significance levels (1%, 5%, and 10%) for the upper bound I(1), the null hypothesis of no long-term relationship is rejected. This confirms the presence of cointegration among the variables, justifying the use of an ARDL model to analyze short- and long-term dynamics [61]. These results align with previous empirical studies that utilized the ARDL test to model complex economic relationships [67].
4.5. Results of the ARDL Estimation
After confirming cointegration, Table 4 presents the estimated long-run and short-run coefficients. The study proceeds with the estimation of the ARDL model with an error correction mechanism (ECM) to analyze the long-term relationship as well as the short-term dynamics between the proportion of the elderly population (EPP) and the explanatory variables: EG, inflation (INF), unemployment rate (UNEM), hospital beds per 1,000 inhabitants (HB), and HE.
The overall quality of the model (Table 5), with an R2 of 0.8098, indicates that 80.98% of the variability in the change in the proportion of the elderly population (D(LOG_EPP)) is explained, demonstrating a good fit to the data. Moreover, the F-statistic of 9.9325 (p = 0.000009) confirms the overall significance of the model, and the Durbin-Watson value of 2.447 suggests the absence of residual autocorrelation, reinforcing the reliability of the estimates.
| Null hypothesis: No level relationship | |||||||
| Number of cointegrating variables: 5 | |||||||
| Trend type: Rest. constant (Case 2) | |||||||
| Test Statistic | Value | ||||||
| F-statistic | 6.459 | ||||||
| 10% | 5% | 1% | |||||
| Sample Size | I(0) | I(1) | I(0) | I(1) | I(0) | I(1) | |
| 30 | 2.407 | 3.517 | 2.910 | 4.193 | 4.134 | 5.761 | |
| 35 | 2.331 | 3.417 | 2.804 | 4.013 | 3.900 | 5.419 | |
| Asymptotic | 2.080 | 3.000 | 2.390 | 3.380 | 3.060 | 4.150 | |
| Variable | Coefficient | Std. Error | t-Statistic | Prob. | Relationship |
|---|---|---|---|---|---|
| COINTEQ | -0.145169 | 0.018245 | -7.956476 | 0.0000 | Long-term |
| LOG_EG(-1) | -0.014295 | 0.010256 | -1.393780 | 0.1837 | |
| LOG_HB(-1) | 0.065899 | 0.016762 | 3.931574 | 0.0013 | |
| LOG_HE | 0.039471 | 0.182965 | 0.215729 | 0.8321 | |
| LOG_INF(-1) | -0.005687 | 0.003119 | -1.823489 | 0.0882 | |
| LOG_UNEM(-1) | -0.036290 | 0.015973 | -2.271950 | 0.0382 | |
| C | 0.180995 | 0.310694 | 0.582550 | 0.5689 | |
| D(LOG_EPP(-1)) | -0.937856 | 0.157099 | -5.969847 | 0.0000 | Short-term |
| D(LOG_EPP(-2)) | -0.455860 | 0.165402 | -2.756078 | 0.0118 | |
| D(LOG_EG) | -0.004395 | 0.002410 | -1.823520 | 0.0825 | |
| D(LOG_HB) | -0.029493 | 0.011514 | -2.561490 | 0.0182 | |
| D(LOG_HB(-1)) | -0.055746 | 0.015325 | -3.637609 | 0.0015 | |
| D(LOG_INF) | -0.003429 | 0.001087 | -3.155651 | 0.0048 | |
| D(LOG_UNEM) | 0.007775 | 0.021389 | 0.363487 | 0.7199 | |
| D(LOG_UNEM(-1)) | 0.062446 | 0.020355 | 3.067815 | 0.0058 | |
| D(LOG_UNEM(-2)) | 0.057167 | 0.017938 | 3.186855 | 0.0044 | |
| R-squared | 0.809 | ||||
| Adjusted R-squared | 0.728 | ||||
| F-statistic | 9.932 | ||||
| Prob(F-statistic) | 0.000 | ||||
| AIC | -7.526 | ||||
| Schwarz criterion | -7.063 | ||||
| Han.-Quinn criter | -7.375 | ||||
| Durbin-Watson stat | 2.447 | ||||
4.6. Short-Term Dynamics
As presented in Table 5, the short-term dynamics reveal significant relationships between the explanatory variables and the change in the proportion of the elderly population (D(LEPP)). The negative and significant coefficients of D(LEPP(-1)) (-0.9379, p = 0.0000) and D(LEPP(-2)) (-0.4559, p = 0.0118) suggest that past changes in the proportion of the elderly population negatively influence the current variation. This reflects persistence or inertia in demographic dynamics [71]. This inertia can be attributed to several demographic and socioeconomic mechanisms. The cohort effect, where large generations (such as baby boomers) progressively reach an advanced age, plays a key role in the increase in the proportion of the elderly population [72]. Conversely, smaller generations slow down this trend. This phenomenon is intrinsically linked to demographic aging, a natural process influenced by fertility and mortality trends [73]. Demographic trends, such as fertility and mortality, evolve slowly, creating inertia in demographic dynamics. For example, a decline in birth rates today reduces the number of young workers in the future, thus increasing the proportion of the elderly population [74]. Similarly, improvements in life expectancy contribute to a sustained increase in this population [75]. Public policies play a crucial role in these trends. Policies supporting birth rates (family allowances, parental leave, and access to childcare) can mitigate demographic aging by stimulating births [76]. Conversely, a lack of support can exacerbate declining birth rates, increasing the proportion of the elderly population. Health policies focused on improving care and prevention extend life expectancy, accelerating demographic aging [77].
Economic growth (D(LEG)) shows a marginally negative relationship (-0.0044, p = 0.0825), suggesting that a short-term increase in growth could slightly reduce the proportion of the elderly population. However, this relationship remains weak, which aligns with the findings of [43], who argue that the interactions between economic development and demographic transitions are complex and context dependent. Indeed, while economic growth may induce changes in demographic structure, the short-term effect remains modest and insufficient to reverse demographic trends related to aging.
The number of hospital beds (D(LHB) and D(LHB(-1)) shows significant negative coefficients (-0.0295, p = 0.0182 and -0.0557, p = 0.0015), indicating that an increase in hospital resources could reduce the proportion of the elderly population in the short-term, potentially by improving overall health and reducing dependency [78]. Inflation (D(LINF)) also has a significant negative relationship (-0.0034, p = 0.0048), which may reflect the impact of economic pressures on vulnerable populations, as suggested by [79] in their studies on the distributive effects of inflation.
Unlike the current unemployment rate (D(LUNEM)), which has no significant impact (0.0078, p = 0.7199), past variations in unemployment (D(LUNEM(-1)) and D(LUNEM(-2))) have significant positive effects (0.0624 and 0.0572, p < 0.01), suggesting that past economic shocks, such as unemployment, can positively influence the proportion of the elderly population [3]. These effects can be explained by socioeconomic mechanisms, including delays in the formation of new generations due to economic uncertainty, as well as changes in migration patterns, where young workers leave regions affected by unemployment for more economically dynamic areas, thereby contributing to the aging of the local population [80]. Additionally, declining birth rates during periods of unemployment, driven by economic insecurity, and internal migration amplify the phenomenon of demographic aging in economically disadvantaged areas [81]. These results highlight the importance of lagged effects in the analysis of demographic and economic dynamics, illustrating that demographic transitions are also shaped by past economic events whose impacts unfold over time [82].
4.7. Long-Term Relationship
The error correction coefficient (COINTEQ) (-0.1452, p = 0.0000) indicates an adjustment speed of 14.52% per year toward long-term equilibrium, reflecting slow but significant convergence [83]. This shows that temporary imbalances are gradually corrected. The constant (C = 0.1810, p = 0.5689) is insignificant, suggesting that the explanatory variables capture the main determinants of the change in the proportion of the elderly population, with no unexplained trend [84, 85]. The ARDL (3,1,2,0,1,3) model, which is selected via the Akaike criterion (AIC), ensures a good balance between fit quality and parsimony after 3072 possible models are evaluated, which guarantees the robustness of the results [86].
For the change in the proportion of the elderly population, the coefficient of D(LEPP(-1)) is -0.9379 and highly significant (p = 0.000). This indicates that the change in the proportion of the elderly population one year ago has a significant negative effect on the current change. This result reflects strong inertia in demographic dynamics, where past trends heavily influence current developments. This inertia can be attributed to the persistence of demographic behaviors, such as fertility and mortality rates, which evolve slowly in the short-term (Wooldridge, 2016). The coefficient of D(LEPP(-2)) is -0.4559 and is also significant (p = 0.0118). This shows that the change in the proportion of the elderly population two years ago negatively influenced the current change. These results confirm the persistence of short-term demographic effects, which are likely linked to mechanisms such as the cohort effect and the stability of fertility and mortality trends [87]. The cohort effect, in particular, suggests that past generations continue to influence the current demographic structure, even after several years [88].
Furthermore, regarding economic growth, the coefficient of D(LEG) is -0.0044 and marginally significant (p = 0.0825). This suggests a slight negative short-term relationship between economic growth and the change in the proportion of the elderly population. This relationship could be explained by the fact that rapid economic growth may temporarily attract a young and active population, reducing the relative proportion of the elderly [89]. However, the marginal significance of this coefficient indicates that this relationship might be influenced by other factors not accounted for in the model.
For the number of hospital beds, the coefficient of D(LHB) is -0.029 and is significant (p = 0.018). This indicates a negative short-term relationship between the number of hospital beds and the change in the proportion of the elderly population. This could reflect a time lag between investments in healthcare infrastructure and their effects on demographic structure. In other words, investments in healthcare infrastructure may take time before translating into significant changes in the proportion of the elderly population. The coefficient of D(LHB(-1)) is -0.055 and is significant (p = 0.001). This shows that the increase in the number of hospital beds in the previous year hurts the current change in the proportion of the elderly population. These results suggest that investments in healthcare infrastructure can have delayed effects on the proportion of the elderly population, likely by improving life expectancy and quality of life [78]. However, the short-term negative impact could also indicate that these investments initially attract a younger population before the effects of aging become apparent.
Thus, inflation (LINF) has a coefficient of D(LINF) of -0.003, which is statistically significant (p = 0.004). This result indicates a negative short-term relationship between inflation and the change in the proportion of the elderly population. High inflation can reduce households' purchasing power, limiting their ability to finance healthcare expenses and maintain adequate living conditions for the elderly [90]. This relationship highlights the adverse effects of economic instability on vulnerable populations, particularly elderly individuals, whose fixed resources are often eroded by rising prices. Additionally, high inflation can influence household consumption and savings decisions, reducing investments in preventive or curative healthcare services, which could indirectly affect demographic structure [91]. These dynamics underscore the importance of economic policies aimed at stabilizing prices and protecting purchasing power, especially for elderly individuals, to ensure sustainable demographic balance. Indeed, as the authors emphasizes, economic conditions play a crucial role in determining the quality of life and life expectancy of elderly individuals, which can have long-term implications for the demographic composition of the population [92]. Therefore, managing inflation appears to be a key lever for mitigating the negative effects of demographic aging and ensuring a balanced demographic transition.
Finally, the unemployment rate (LUNEM) has a coefficient of D(LUNEM) of 0.0078, which is not statistically significant (p = 0.719). This suggests that the current change in the unemployment rate does not have a significant effect on the change in the proportion of the elderly population in the short-term. However, the lagged effects of unemployment emerge as a determining factor. The coefficients of D(LUNEM(-1)) and D(LUNEM(-2)) are 0.062 and 0.057, respectively, and are significant (p < 0.01), indicating that past changes in the unemployment rate have a positive effect on the current change in the proportion of the elderly population. This relationship can be explained by the cumulative effects of unemployment on demographic behaviors. For example, high unemployment in the past may have led to a decline in birth rates, as households delay or forgo having children during periods of economic uncertainty [93]. Additionally, unemployment may prompt young workers to migrate to regions or countries offering better job opportunities, thereby accelerating the aging of the local population by reducing the proportion of young workers [94]. These results highlight the importance of considering the long-term effects of economic policies on the demographic structure. Indeed, decisions made today to combat unemployment can have lasting repercussions on population composition, particularly by influencing aging dynamics. As [95] emphasizes, policies aimed at reducing unemployment and promoting youth employment are essential to mitigate demographic imbalances and foster harmonious population aging. Thus, a forward-thinking and holistic strategy, which accounts for the delayed impacts of unemployment, is crucial to proactively anticipate and address the challenges linked to demographic aging.
Moreover, reducing unemployment plays a crucial role in strengthening the revenues of social institutions and improving intergenerational solidarity. A lower unemployment rate increases the number of active contributors to the social protection system, thereby increasing the resources available to fund pensions, healthcare, and social services for the elderly [92]. Indeed, an employed working-age population generates greater social contributions, which help sustain healthcare and pension systems that are often strained by demographic aging. Additionally, reducing unemployment promotes social cohesion by limiting economic inequalities and strengthening households' ability to contribute to the financing of public services, including those dedicated to the elderly [78]. This contributes to a more equitable distribution of resources and greater solidarity between generations.
4.8. Autocorrelation (Breusch‒Godfrey Serial Correlation LM) Test
The Breusch‒Godfrey serial correlation LM test reveals the absence of a serial correlation in the model, as revealed by the results in Table 6. The probability value of the F-statistic confirms that the residuals are serially uncorrelated.
| Breusch-Godfrey Test | Value | p value | Conclusion. |
|---|---|---|---|
| Null Hypothesis (H0) | No serial correlation up to three lags. | ||
| F-statistic | 0.698 | 0.5706 | Fail to reject H0 (p-value > 0.05). |
| Lagrange Multiplier Statistic (Obs*R2) | 4.609 | 0.2027 | Fail to reject H0 (p-value > 0.05). |
| Durbin-Watson (previously reported) | 2.447 | - | Confirms no autocorrelation (value close to 2). |
4.9. Normality Test for the Residual (Histogram and JB) Test
The probability value of 0.677, which is greater than the 0.05 critical value for the Jarque-Bera test, is a reasonable cause for accepting the null hypothesis that the error term follows a normal distribution, as shown in Fig. (2). The x-axis represents the values of the model’s residuals, while the y-axis shows the frequency of their occurrence within the sample.
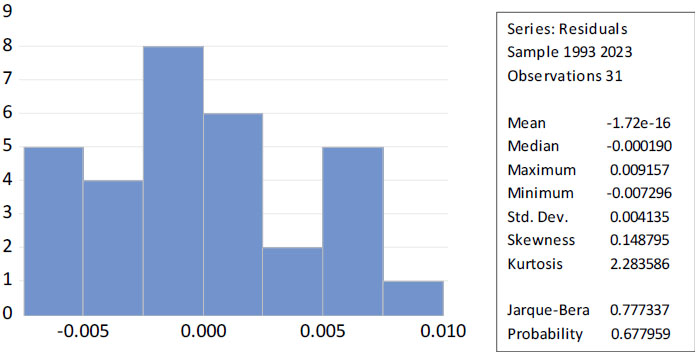
Histogram and JB Test for the Residual.
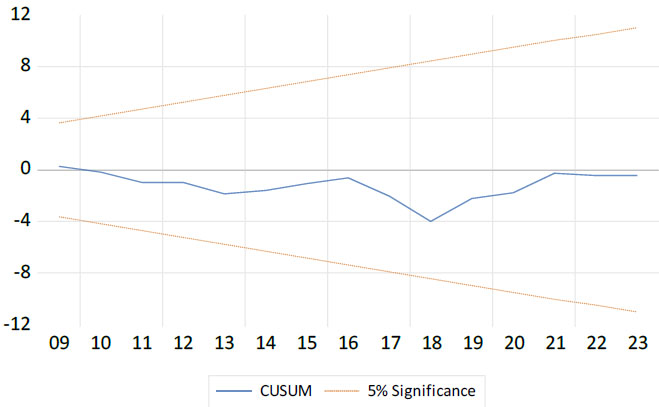
Cumulative sum (CUSUM) stability test.
4.10. Stability Test (CUSUM Graph)
The results in Fig. (3) show that the model is stable from 1990--2023. The x-axis represents the time period or observation index, while the y-axis shows the cumulative sum of recursive residuals (CUSUM). The blue line represents the evolution of the CUSUM statistic over time, and the two orange dashed lines indicate the 5% significance bounds. The CUSUM line remains consistently within the 5% critical significance bounds without ever crossing them. This confirms that the model is robust and reliable over the entire study period, with no signs of structural instability.
CONCLUSION AND RECOMMENDATIONS
This study analyzed how economic factors and healthcare capacity influence Morocco's aging population using an ARDL model, revealing significant short- and long-term impacts. The findings highlight the need for integrated policies combining economic stability, healthcare investment, and intergenerational equity to address demographic challenges.
Key findings confirm a cointegration relationship between the variables, highlighting long-term interdependence between economic factors, health infrastructure, and the proportion of the elderly population. The error correction coefficient indicates a slow but significant convergence toward equilibrium, with an adjustment speed of 14.52% per year. In the short-term, demographic inertia persists, with past variations negatively influencing current dynamics. Economic growth has a marginally negative effect, suggesting the attraction of younger populations. The increase in hospital infrastructure temporarily reduces the proportion of elderly individuals, likely due to an improvement in overall health. Inflation exerts a significant negative effect, limiting household resources for HE. Current unemployment is not significant, but past variations positively influence the proportion of elderly individuals, likely through a decline in birth rates and out-migration of young working-age individuals. The robustness of the model is confirmed via Breusch‒Godfrey (autocorrelation), JB (normality of residuals), and CUSUM (structural stability) tests, ensuring the reliability of the estimates.
To mitigate the effects of demographic aging in Morocco, several measures must be considered. First, strengthening health infrastructure is essential. Investing in hospital beds and developing medicosocial facilities will improve access to healthcare and ensure tailored support for the needs of seniors. Moreover, stabilizing economic policies is necessary to protect retirees' purchasing power in the face of inflation and to promote job creation, thus enhancing intergenerational solidarity.
Furthermore, the study highlights the critical influence of economic factors and healthcare capacity on Morocco’s aging population. To address these challenges, policymakers should prioritize three actionable measures: (1) economic reforms, including inflation-indexed pensions and labor policies that incentivize hiring older workers; (2) targeted healthcare investments, such as increasing hospital bed capacity by 30% in rural areas by 2030 and allocating 5% of GDP to health—with a focus on geriatric and chronic disease care; and (3) intergenerational solidarity policies, like tax breaks for families caring for elderly relatives and expanding AMO to cover preventive services. These concrete steps would safeguard the elderly well-being, reduce fiscal strain on social systems, and ensure sustainable demographic resilience.
Finally, a multidimensional approach is essential. Enhanced coordination between various ministries would enable the development of coherent public strategies tailored to the challenges of aging. In this context, the establishment of redistribution mechanisms would ensure a fair distribution of resources across generations, guaranteeing a sustainable social and economic balance.
This study offers valuable insights into Morocco's aging dynamics, though some limitations should be acknowledged. The constrained study period (1990-2023) and reliance on secondary data may affect long-term trend analysis, while the ARDL model's simplification of complex socioeconomic interactions suggests the need for future research incorporating migration patterns, cultural factors, and regional disparities to enhance policy relevance.
Certain essential determinants were not included in the analysis, notably sociocultural factors (family norms, health behaviors) and technological advancements, which influence longevity and the efficiency of care. Furthermore, the ARDL model does not allow for establishing definitive causality between variables, and the assumed linearity of relationships may not reflect the full complexity of economic and health interactions.
Finally, the absence of projections limits the prospective scope of the study. Integrating alternative scenarios would allow for the anticipation of future aging-related demographic trends. Furthermore, unforeseen exogenous shocks, such as economic or health crises, remain unaddressed elements that could significantly alter the observed dynamics.
Future research should pursue three complementary directions to advance understanding of aging dynamics in Morocco. First, extending the temporal scope through historical data and projections would better capture long-term demographic trends. Second, incorporating regional-level analysis could reveal important territorial disparities in aging experiences. Third, integrating sociocultural factors and technological innovations through advanced modeling techniques would provide a more holistic perspective. Together, these approaches - combined with comparative studies and microdata analysis - would yield robust evidence to inform targeted policy responses to Morocco's aging challenges while addressing the current study's limitations.
AUTHORS’ CONTRIBUTIONS
The authors confirm their contribution to the paper as follows: M.M., A.B.: Contributed to the study conception and design;. M. M.: also contributed to the writing of the manuscript;. I.C.: Contributed to the analysis and interpretation of the results. D.H.: Drafted the manuscript;. R.F., C.M.: Contributed to the development and refinement of the research framework;. All authors reviewed the results and approved the final version of the manuscript.
LIST OF ABBREVIATIONS
| AMO | = Mandatory Health Insurance |
| QALYs | = QualityAdjusted Life Years |
| UNEM | = Unemployment Rate |
| HE | = Health Expenditures |
| CUSUMSQ | = Cumulative Sum of Squares of Recursive Residuals |
| COINTEQ | = The Error Correction Coefficient |
AVAILABILITY OF DATA AND MATERIALS
The data supporting the findings of this study are available within the article. Additional datasets or materials, if required, can be provided upon reasonable request to the corresponding author [M.M].
FUNDING
This research did not receive any specific grant from funding agencies in the public, commercial, or not-for-profit sectors.
CONFLICT OF INTEREST
The authors confirm that there is no conflict of interest related to the manuscript.
ACKNOWLEDGEMENTS
The author would like to express sincere gratitude to Professor Rachid Hasnaoui for his valuable support and guidance in the field of public policy.